Applied Project Day 01 – Saturday 07/10/17
Review email from Professor Paul de Bra (19 June 2017 12:56)
Study the attached PowerPoint file gale-installation.pptx
(1) Download JDK Version 7 from the following link:
Java SE 7 Archive Downloads
http://www.oracle.com/technetwork/java/javase/downloads/java-archive-downloads-javase7-521261.html
(2) Install JDK Version 7 as follows:
(a) Install the JDK by double-clicking on jdk-7u80-macosx-x64.dmg and following the installation instructions.
(b) Open a Terminal window.
(c) Execute the command java -version (returned java version “1.7.0_80”) – SUCCESS!
(d) Execute the command javac -version (returned javac 1.7.0_80) – SUCCESS!
(3) Install Homebrew as follows: (but not currently required)
(a) Open a Terminal window
(b) Execute the command dsenableroot
(c) Enter the user password (as prompted)
(d) Enter the root password (as prompted)
(e) Execute the command ruby -e “$(curl -fsSL https://raw.githubusercontent.com/Homebrew/install/master/install)”
Homebrew will install.
(f) Execute the command brew doctor (returned Your system is ready to brew) – SUCCESS!
(4) Download Tomcat version 7.0.82 from the following link:
http://tomcat.apache.org/download-70.cgi
(a) Under binary distributions, click on tar.gz (pgp, md5, sha1)
(b) In Finder, move the apache-tomcat-7.0.82.tar.gz file from Downloads to the home folder.
(c) Unzip the apache-tomcat-7.0.82.tar.gz file
(d) Rename the resulting apache-tomcat-7.0.82 folder to tomcat
(5) Start the Tomcat Server as follows:
(a) Open a Terminal window.
(b) Execute the command cd tomcat
(c) Execute the command cd bin
(d) Execute the command chmod 755 *.sh
(e) Execute the command sudo ./startup.sh (returned Tomcat started) – SUCCESS!
(6) Stop the Tomcat Server as follows:
(a) Open a Terminal window.
(b) Execute the command cd tomcat
(c) Execute the command cd bin
(d) Execute the command sudo ./shutdown.sh (returned 5 lines including Using CATALINA_BASE: /Users/gerardkilkenny/tomcat)
(e) Execute the command cd ..
(f) Execute the command cd logs
(g) Execute the command cat catalina.out
(h) The 41st of 45 INFO lines states INFO: Stopping service Catalina – SUCCESS!
(7) Download GALE using HSQLDB (version 1.2.3) from the following link:
http://gale.win.tue.nl
(a) In Finder, move the gale-1.2.3-hsqldb.zip file from Downloads to the home folder.
(b) Unzip the gale-1.2.3-hsqldb.zip file
(c) Move the resulting gale.war file to tomcat/webapps
(8) Set the environment variable GALE_HOME as follows:
(a) In Finder, create the folder gale in the home folder
(b) Open a Terminal window
(c) Execute the command defaults write com.apple.finder AppleShowAllFiles -bool TRUE
(d) Relaunch Finder by holding the ‘Option/alt’ key, right clicking on the Finder icon in the dock and then clicking Relaunch
(e) In Finder, go to the home folder and note that a number of hidden files are now visible including .bash_profile
(f) Make a copy of the file .bash_profile for safety reasons.
(g) Right-click on the file .bash_profile and choose Get Info
(h) Click on the the lock icon under Sharing & Permissions
(i) Change all three privileges to Read & Write
(j) In Terminal, execute the command open ~/.bash_profile
(k) In TextEdit, add export GALE_HOME=/gale
(l) Choose File and Save
(m) Quit Terminal using the Command and Q keys
(n) Open a new Terminal Window
(o) Execute the command echo $GALE_HOME (returned /gale) – SUCCESS!
(p) Right-click on the file .bash_profile and choose Get Info
(q) Click on the the lock icon under Sharing & Permissions
(r) Change all three privileges to Read Only
(s) Execute the command defaults write com.apple.finder AppleShowAllFiles -bool FALSE
(9) Start and test GALE for the first time as follows:
(a) Copy (not move) the gale.war file from the folder /tomcat/webapps to the folder /gale
(b) Open a Terminal window
(c) Execute the command cd gale
(d) Execute the command jar xf gale.war
(e) Execute the command cd gale
(f) Execute the command ls
Note that 19 files are listed including the files Milkyway and tutorial
(g) Execute the command cd tomcat
(h) Execute the command cd bin
(i) Execute the command sudo ./startup.sh (returned Tomcat started) – SUCCESS!
(j) Execute the command cd tomcat/logs
(k) Execute the command cat catalina.out
(l) The last line states INFO: Server startup in 11877 ms – SUCCESS!
(m) Go to a browser and type http://localhost:8080/gale
The Welcome to Gale home page appears
(n) Click on the Milkyway link
(o) Click the Login button to login anonymously
(10) When not using GALE, stop the Tomcat Server – see (6) above
Note: Tomcat may not shut down correctly. Check that Tomcat is not running (use ps or task manager). if it is running, stop/kill the java process.
Applied Project Day 02 – Saturday 14/10/17
Review two emails from Marc Craenen (13 October 2017 22:19 and 14 October 2017 09:21)
(1) Install MySQL as follows (instructions from https://gist.github.com/nrollr/a8d156206fa1e53c6cd6):
(a) Open a Terminal window
(b) Execute the command brew update (returned New Formulae, Updated Formulae, Deleted Formulae)
(c) Execute the command brew info mysql (returned mysql: stable 5.7.19 (bottled))
(d) Execute the command brew install mysql (returned Summary /usr/local/Cellar/mysql/5.7.19: 322 files, 234.8MB)
Caveats: (i) We’ve installed your MySQL database without a root password. To secure it run: mysql_secure_installation
(ii) MySQL is configured to only allow connections from localhost by default To connect run: mysql -uroot
(iii) To have launchd start mysql now and restart at login: brew services start mysql. Or, if you don’t want/need a background service you can just run: mysql.server start
(e) To have launchd start mysql at login, execute the command ln -sfv /usr/local/opt/mysql/*.plist ~/Library/LaunchAgents
(returned /Users/gerardkilkenny/Library/LaunchAgents/homebrew.mxcl.mysql.plist -> /usr/local/opt/mysql/homebrew.mxcl.mysql.plist)
(f) To load mysql immediately, execute the command launchctl load ~/Library/LaunchAgents/homebrew.mxcl.mysql.plist
(returned nothing)
(g) Execute the command defaults write com.apple.finder AppleShowAllFiles -bool TRUE
(h) Relaunch Finder by holding the ‘Option/alt’ key, right clicking on the Finder icon in the dock and then clicking Relaunch
(i) In Finder, go to the home folder and note that a number of hidden files are now visible including .bash_profile
(j) Make a copy of the file .bash_profile for safety reasons (.bash_profile copy 2)
(k) Right-click on the file .bash_profile and choose Get Info
(l) Click on the the lock icon under Sharing & Permissions
(m) Change all three privileges to Read & Write
(n) In Terminal, execute the command open ~/.bash_profile
(o) In TextEdit, add export MYSQL_PATH=/usr/local/Cellar/mysql/5.7.19
(p) In TextEdit, add export PATH=$PATH:$MYSQL_PATH/bin
(q) Choose File and Save
(r) Choose TextEdit and Quit TextEdit
(s) Quit Terminal using the Command and Q keys
(t) Open a new Terminal Window
(u) Execute the command mysql.server start
(returned1 Welcome to the MySQL monitor. Commands end with ; or \g.)
(returned2 Your MySQL connection id is 4)
(returned3 Server version: 5.7.19 Homebrew)
(v) Execute the command mysqladmin -u root password ‘your password’ to set the root password
Quit the mysql CLI via mysql> \q
(w) Right-click on the file .bash_profile and choose Get Info
(x) Click on the the lock icon under Sharing & Permissions
(y) Change all three privileges to Read Only
(z) Execute the command defaults write com.apple.finder AppleShowAllFiles -bool FALSE
Note 1: To start MySQL, execute the command mysql.server start
Note 2: To stop MySQL, execute the command mysql.server stop
(2) Create and populate the MySQL database as follows:
(a) Open a Terminal window
(b) Execute the command type -a mysql to find the path of your mysql bin directory
(returned1 mysql is /usr/local/bin/mysql)
(returned2 mysql is /usr/local/Cellar/mysql/5.7.19/bin/mysql)
(c) Open the folder Macintosh HD on the desktop to access the root directory of your Mac
(d) Navigate to the folder /usr/local/Cellar/mysql/5.7.19/bin
(e) Paste the file gamat.sql inside this folder
(f) Execute the command cd /usr
(g) Execute the command cd local
(h) Execute the command cd cellar
(i) Execute the command cd mysql
(j) Execute the command cd 5.7.19
(k) Execute the command cd bin
(l) Execute the command mysql -u root < gamat.sql
(returned ERROR 1022 (23000) at line 196: Can’t write; duplicate key in table ‘#sql-f62_9’)
(however database was created as verified in Sequel Pro – see below)
(3) Install Sequel Pro as follows:
(a) Go to http://www.sequelpro.com/
(b) Click on the link Download V 1.1.2 OS X 10.6 OR HIGHER
(c) Go to the Downloads folder on your Mac
(d) Double-click on the file sequel-pro-1.1.2.dmg in Downloads
(e) An icon for the app Sequel Pro appears to the right of Sequel Pro 1.1.2 in Devices
(f) Double-click on the icon Sequel Pro
(g) Click Open
(h) In the Host field, type 127.0.0.1
(i) In the Username field, type root
(j) In the Database field, type gamat
(k) Click Connect
(4) Insert data into the users table of the database gamat as follows:
(a) Start up MySQL by executing the command mysql -u root
(b) Type the following 4 lines in the MySQL monitor
mysql> INSERT INTO users
-> (user_id, email, password, username)
-> VALUES
-> (1, “hidden@hidden.com”, “HiddenPassword”, “HiddenUsername”);
(5) Check the users table of the database gamat using Sequel Pro. Click on the Content button and note that a new row containing the four values above has been added.
However, this did not allow me to log in. I eventually discovered that the password is stored as a (encrypted) hash value.
Note 1: Adding export GALE_HOME=/tomcat/webapps/gale to .bash_profile allows access to http://localhost:8080/gale/ However, clicking on the Milkyway application link return
Gale Error
error running LoginManager
java.lang.IllegalArgumentException: error running LoginManager
java.lang.SecurityException: attempt to add a Permission to a readonly Permissions object
Additionally, trying to access the URL http://localhost:8080/author/generate returns
HTTP Status 500 – javax.servlet.ServletException: java.lang.NullPointerException
type Exception report
message javax.servlet.ServletException: java.lang.NullPointerException
description The server encountered an internal error that prevented it from fulfilling this request.
exception
org.apache.jasper.JasperException: javax.servlet.ServletException: java.lang.NullPointerException
org.apache.jasper.servlet.JspServletWrapper.handleJspException(JspServletWrapper.java:561)
org.apache.jasper.servlet.JspServletWrapper.service(JspServletWrapper.java:462)
org.apache.jasper.servlet.JspServlet.serviceJspFile(JspServlet.java:395)
org.apache.jasper.servlet.JspServlet.service(JspServlet.java:339)
javax.servlet.http.HttpServlet.service(HttpServlet.java:731)
org.apache.tomcat.websocket.server.WsFilter.doFilter(WsFilter.java:52)
org.tuckey.web.filters.urlrewrite.RuleChain.handleRewrite(RuleChain.java:176)
org.tuckey.web.filters.urlrewrite.RuleChain.doRules(RuleChain.java:145)
org.tuckey.web.filters.urlrewrite.UrlRewriter.processRequest(UrlRewriter.java:92)
org.tuckey.web.filters.urlrewrite.UrlRewriteFilter.doFilter(UrlRewriteFilter.java:394)
org.tuckey.web.filters.urlrewrite.NormalRewrittenUrl.doRewrite(NormalRewrittenUrl.java:213)
org.tuckey.web.filters.urlrewrite.RuleChain.handleRewrite(RuleChain.java:171)
org.tuckey.web.filters.urlrewrite.RuleChain.doRules(RuleChain.java:145)
org.tuckey.web.filters.urlrewrite.UrlRewriter.processRequest(UrlRewriter.java:92)
org.tuckey.web.filters.urlrewrite.UrlRewriteFilter.doFilter(UrlRewriteFilter.java:394)
root cause
javax.servlet.ServletException: java.lang.NullPointerException
org.apache.jsp.generate_jsp._jspService(generate_jsp.java:121)
org.apache.jasper.runtime.HttpJspBase.service(HttpJspBase.java:70)
javax.servlet.http.HttpServlet.service(HttpServlet.java:731)
org.apache.jasper.servlet.JspServletWrapper.service(JspServletWrapper.java:439)
org.apache.jasper.servlet.JspServlet.serviceJspFile(JspServlet.java:395)
org.apache.jasper.servlet.JspServlet.service(JspServlet.java:339)
javax.servlet.http.HttpServlet.service(HttpServlet.java:731)
org.apache.tomcat.websocket.server.WsFilter.doFilter(WsFilter.java:52)
org.tuckey.web.filters.urlrewrite.RuleChain.handleRewrite(RuleChain.java:176)
org.tuckey.web.filters.urlrewrite.RuleChain.doRules(RuleChain.java:145)
org.tuckey.web.filters.urlrewrite.UrlRewriter.processRequest(UrlRewriter.java:92)
org.tuckey.web.filters.urlrewrite.UrlRewriteFilter.doFilter(UrlRewriteFilter.java:394)
org.tuckey.web.filters.urlrewrite.NormalRewrittenUrl.doRewrite(NormalRewrittenUrl.java:213)
org.tuckey.web.filters.urlrewrite.RuleChain.handleRewrite(RuleChain.java:171)
org.tuckey.web.filters.urlrewrite.RuleChain.doRules(RuleChain.java:145)
org.tuckey.web.filters.urlrewrite.UrlRewriter.processRequest(UrlRewriter.java:92)
org.tuckey.web.filters.urlrewrite.UrlRewriteFilter.doFilter(UrlRewriteFilter.java:394)
Note 2: Removing export GALE_HOME=/tomcat/webapps/gale to .bash_profile allows access to http://localhost:8080/author/generate. However, there is then no access to the URL http://localhost:8080/gale/. It returns:
Applied Project Day 03 – Sunday 15/10/17
(1) I edited the Config.properties file in /tomcat/webapps/ROOT/WEB-INF/config as follows:
db_host = localhost TO db_host = localhost (no change)
db_name = gamat TO db_name = gamat (no change)
db_user = gamat TO db_user = root (user is root)
db_pass = gamatpw TO db_pass = (no password)
db_port = 3307 TO db_port = 3306 (3306 is the default MySQL port)
This got the GAM Authoring Tool via http://localhost:8080/author/generate working!!!
There is a problem with getting GALE working via http://localhost:8080/gale/. I am getting the following error messages:
404 Not Found
Error! The requested page could not be found.
(2) Six emails were exchanged between Marc Craenen (software developer of the new GAM Authoring Tool) and I in relation to installing and configuring the new software.
Applied Project Day 04 – Monday 16/10/17
Below is the rationale for developing a new domain tool that does not use a graph to represent the relations between concepts in a domain.
AHA!
“The Graph Author for AHA! was first described in [5]. A snapshot of this interface is shown in Figure 1. The figure shows two panes: the left pane shows part of a hierarchy of concepts, also called a domain model. The right pane shows all “pedagogical rules” in what we call the adaptation model. The adaptation rules that implement the behavior are drawn from a template. The design of such templates is left to an expert. Authors just “draw arrows”. When the domain and adaptation models become much larger than in the figure the accordion menu keeps the domain model readable whereas the graph representing the adaptation model will become cluttered and unreadable.” (pp.1-2)
“In the European research project GRAPPLE1 GALE [16, 17] was created as successor to AHA! and a corresponding graphical authoring tool GAT [7] was created as well. The GAT tool consists of three parts: a domain tool, a pedagogical relationship tool and a course tool. Figure 2 shows the graph part of the domain tool and Figure 3 shows the graph part of the course tool.” (p .2)
“The Domain Tool2 in GAT allows for labeled binary relations between concepts. The domain model can thus become a richly interconnected collection of concepts, much like a domain-specific ontology. It can be much richer than the purely hierarchical domain model shown by the GraphAuthor tool in figure 1. At the same time the graph presentation (instead of an accordion menu) quickly becomes cluttered and unreadable as the domain model grows.” (p. 2)
For the adaptive part of an application GAT uses the CourseTool3 (initial design ideas described in [13]), shown in figure 3. It uses a very compact graphical representation for a collection of adaptation rules that would make for a huge graph in the GraphAuthor, but it does not make it easy to see which incoming and outgoing pedagogical relations (like prerequisites) each concept has.” (p. 2)
“During a course on adaptive hypermedia students were given a choice of using GAT to develop a GALE application or using the underlying adaptation language GAM directly. Students using GAT were generally less happy than students using GAM. Still, when in the next run of this course we asked students to only use GAM and evaluate it, writing the adaptation rules was found to be the most technically challenging part of authoring [15]. Hence the need for a new authoring tool described in this paper.” (p. 2)
“The investigation into these different authoring environments has taught us that an interface for displaying and editing a concept hierarchy appears to work well and scales well with growing applications, and that displaying a graph of relations between concepts always leads to visual clutter with larger models.” (p. 2)
“In GALE an application (or course) consists of concepts. Each concept has a number of (named) properties that have a fixed value and (named) attributes that have a value that is computed through rules. Typical use of these attributes (of which the names and meaning can be chosen arbitrarily) includes:
- a Boolean attribute suitability to check that all prerequisites for the concept are satisfied.
- an integer attribute visited to count how many times the user has visited the concept.
- a real (Double) attribute knowledge to keep track of the user’s knowledge of the concept.” (p. 3)
Default Attributes:
Suitability = True or Suitability = False
Visited = 3
Knowledge = 0.7
“Finally, concepts can also have relationships between them. In GALE there are two predefined relationships:
When concept A extends concept B it inherits all the properties and attributes (from B). We can define one “generic” concept with properties and attributes and then have all other concepts extend it.
Through the parent relationships we build a hierarchy of concepts. GALE also offers views to present (parts of) the concept hierarchy as a navigation menu (for instance as an accordion menu).” (p. 3)
Relationships:
Concept A extends Concept B => Concept A inherits all the properties and attributes from Concept B
Parent Relationships => Hierarchy of Concepts
For example, in the Milkyway application, Planet is a parent, source and prerequisite of Jupiter, Mars, Earth, etc.
Blueprints (templates) that define a structure common to all concepts of an application have 3 parts as follows:
Default Attribute Rules: (def_att_rules)
Name = HasPreRequisite
Type = Binary
Target = Suitability
Code = TargetKnowledge > 0.8
Operator = And
{
“def_att_rules”:[
{
“name”:”hasprerequisite”,
“type”:”binary”,
“target”:”suitability”,
“tooltip”:
“Target concept must be learned
before source is recommended.”,
“code”:”${%target%#knowledge} > 0.8″,
“operator”:”and”
}
]
NOTE: The above must mean that the student should have a knowledge of greater than 80% about the target (say star or Sun) before the source is recommended (say planet or Saturn)
Persistent Attribute Rules: (persistent_att_rules)
Name = Visited
Type = Unary
Properties:
Name = Visited
Type = Integer
NOTE: I don’t understand the above – Type = Unary and Type = Integer.
Default Relations:
Name = Rotates Around
Tooltip = “Source concept rotates around the target object.”
NOTE: (This must mean that the source concept is (say) planet and rotates around the target object which is star) or
NOTE: (This could mean that the source concept is (say) Saturn and rotates around the target object which is Sun)
QUESTION: Why not say that the “Source concept rotates around the target concept.” ?
NOTE: (This must mean that the target object of star must be learned before source concept is recommended.”
QUESTION: Why is target concept used in “def_att_rules” above (“Target concept must be learned before source is recommended.”) and target object used in the Tooltip above (“Source concept rotates around the target object.”) ? CONFUSING!!!
QUESTION: Is Planet a concept type and Saturn a concept? (or is it the other way around?)
QUESTION: If it’s the former, then is concept type a target and concept a source?
‘In adaptive courses a concept may have some prerequisites, and in our example the concept Earth has two prerequisites: Planet and Sun. We not only show some prerequisites but also added some more relationships (isMoonOf and isPlanetOf).” (p. 5)
QUESTION: When adding an attribute for a concept type, there are 4 fields as follows:
Attribute name: next
Type: String
Operator: = or =+ or &= or |=
Value (optional): next topic
What is the Operator field for?
How are Operators used?
Only Attribute name, Type, Value appear in Figure 5 (p. 4)
QUESTION: Why can’t one edit Relationships? (can only delete them with thrash can icon)
BUG: If incoming_attr and outgoing_attr are left blank, list of Concepts under Manage => Concepts disappears.
BUG: The Add a relationship functionality does not work. The Select a relation drop-down list box is blank (contains …)
QUESTION: What is a property? What does it mean by “Properties can be useful for adding events.”
BUG: The Create a new concept or concept type does not appear to work. Specifically, neither Choose a parent concept or Choose concept types this concept should belong to appear to work.
QUESTION: Why is it not possible to create a concept with less than 4 characters, e.g. Sun?
QUESTION: Why is it not possible to create a concept with the hyphen character, e.g. The-Sun? (since spaces are not allowed). Note: There appears to be a restriction to alphanumeric characters.
BUG: Attributes do not appear in the order added. If you compare the list under Attributes on the web page, you will see that it appears in a different order to the ordered list in the database table (Sequel Pro)
Reference
De Bra, P., Stash, N., Boereboom, W., Chen, C., Den Ouden, J., Kunstman, M., . . . Verbakel, E. (2016). ALAT: Finally an Easy To Use Adaptation Authoring Tool. Paper presented at the Proceedings of the 27th ACM Conference on Hypertext and Social Media, Halifax, Nova Scotia, Canada. https://doi.org/10.1145/2914586.2914627
Link
http://wwwis.win.tue.nl/~debra/ALAT.pdf
Applied Project Day 05 – Saturday 21/10/17
Install GeoGebra Classic 6 on my Mac
Create folder Maths Files
Create two sub-folders: Scanned Roughwork and GeoGebra
Scan first version 01-Linear_Sequence.pdf (2 page file)
Scan first version 01-Algebra_Formulae.pdf (1 page file)
COPY THESE TWO .PDF FILES TO THE Scanned Roughwork FOLDER
Create the file Linear_Sequence(Number_0)Y.ggb
Create the file Linear_Sequence(Graph_0)Y.ggb
COPY THESE TWO .GGB FILES TO THE GeoGebra FOLDER
Create the HTML5 versions of the two .GGB files. This will also create the support files in a folder called Geogebra.
COPY THESE TWO .HTML FILES TO FOLDERS CALLED Linear_Sequence(Number_0)Y and Linear_Sequence(Graph_0)Y
Note: A GeoGebra folder containing the support files is created for each .HTML file. However, when uploading to a web server, only one GeoGebra folder containing one set of support files is required.
Upload the HTML versions of the two files to my ePortfolio (gerardkilkenny.ie) using FileZilla and test on Mac and iPad. Both files work!
Applied Project Day 06 – Monday 23/10/17
Receive and send emails (one each) to/from Marc Craenen.
Email received is a comprehensive response to the questions and bugs in my emails sent to him on 16/10/17 and 23/10/17.
Email sent to him is to follow up on his availability to log in to my Mac using TeamViewer on Thursday, Friday, Saturday of this week.
Applied Project Day 07 – Tuesday 24/10/17
Review emails received yesterday from Marc Craenen.
Use the GAM Authoring Tool to recap on existing bugs in the software.
Applied Project Day 08 – Thursday 26/10/17
2 emails sent to Marc Craenen.
5 emails sent to Marc Craenen.
Test remote login to my iMac from my Windows 10 laptop using TeamViewer. (Success!).
2 hours 26 minutes spent on a WhatsApp call and TeamViewer session with Marc Craenen.
Go through all of the questions, bugs and errors (12 questions, 4 bugs, 1 error) in the email sent to me by Marc Craenen on Monday 23rd October 2017 at 19:28.
Email Marc a SQL dump so that he can try to resolve the following error documented in my email to Marc on 23rd October 2017:
—ERROR 1022 (23000) at line 196: Can’t write; duplicate key in table ‘#sql-f62_9’ which occurred when I executed the command mysql -u root < gamat.sql to create and populate the gamat database.
Receive printscreens file from Marc containing a concept structure nested hierarchically. Due to a bug in Marc’s software, two records in the database failed to be created. These 2 records have the field full_name and should have been populated by the strings “extends” and “has parent” when the gamat database was originally created.
To investigate why GALE won’t launch, generate Tomcat logs and email them to Marc. (The filenames are catalina.2017-10-26.log and localhost.2017-10-26.log).
Test Generate Project via the URL: http://localhost:8080/author/generate
This generates the following 2 links:
http://localhost:8080/data/project/2/output.zip (which is the output of your project is bundled in the outtput.zip file)
http://localhost:8080/gale/concept/http://localhost:8080/data/project/2/Milkyway (which produces a 404 error instead of allowing you to view your project by visiting this particular URL)
Learn about hierarchical menu, parent, extends, relationships, concepts, concept types, properties and events (adaptation model)
Use ALAT.pdf and also use:
http://gale.win.tue.nl:10080/gale/concept/gale://gale.tue.nl/course/grapple/gale_domainmodel?view=static-tree-view (domain model)
http://gale.win.tue.nl:10080/gale/concept/gale://gale.tue.nl/course/grapple/gale_adaptationmodel?view=static-tree-view (adaptation model)
Applied Project Day 09 – Saturday 28/10/17
Edit the following 2 files:
Linear_Sequence(Number_0)Y.ggb
Linear_Sequence(Graph_0)Y.ggb
Rename the 2 files to:
01-Seq(No_0)Y.ggb
02-Seq(Gra_0)Y.ggb
Create the following 3 files and save them to the GeoGebra folder on my Mac
03-Slope (Gra_0)Y.ggb
04-Slope(Tab_0)XY.ggb
05-Slope(Tab_1)XY.ggb
Applied Project Day 10 – Sunday 29/10/17
Create the following 4 files and save them to the GeoGebra folder on my Mac
06-Fun(Tab_0)XY.ggb
07-Fun(Tab_1)XY.ggb
08-Seq(Tab_0)XY.ggb
09-Seq(Tab_1)XY.ggb
30/10/17 (Monday) – Applied Project Day 11
Create the folder C:\Adaptive Learning Databases\Mk 4 on my laptop.
Copy the Microsoft Access database file Adaptive Maths Rel Pop Query Test C.mdb from the folder Mk3 to Mk4.
Delete the content of this database file and repopulate it with the following topic data from the syllabus PDF file Junior Certificate Mathematics Syllabus (Foundation, Ordinary & Higher Level) for examination from 2016:
2.2 Co-ordinate Geometry (Strand 2)
4.1 Generating arithmetic expressions from repeating patterns (Strand 4)
4.2 Representing situations with tables, diagrams and graphs (Strand 4)
4.3 Finding formulae (Strand 4)
5.1 Functions (Strand 5)
5.2 Graphing functions (Strand 5)
_______________________________________________________________________________________________________________________________________________________________________________________________________________________________________
01/11/17 (Wednesday) – Applied Project Day 12
Edit the Relationships in the Microsoft Access database file Adaptive Maths Rel Pop Query Test C.mdb in the folder Mk4.
Create the database query Outcomes to produce the 31 learning outcomes in the domain specified in my Research Proposal.
These learning outcomes may be found in the following topics in Strands 2, 4, 5 of the syllabus PDF file Junior Certificate Mathematics Syllabus (Foundation, Ordinary & Higher Level) for examination from 2016:
2.2 Co-ordinate geometry
4.1 Generating arithmetic expression from repeating patterns
4.2 Representing situation with tables, diagrams and graphs
4.3 Finding formulae
5.1 Functions
5.2 Graphing functions
Export the output of this query to the file Outcomes.xlsx.
Edit the file Outcomes.xlsx to produce the following Excel files:
Outcomes (Formatted).xlsx – edited to fit on a single A4 page
Outcomes (Formatted_Greyed_Out).xlsx – 11 learning outcomes greyed out. Note: These 11 learning outcomes don’t have connections between Strands 2, 4, 5.
Outcomes (Formatted_Deleted).xlsx – 11 learning outcomes deleted. Note: There are now 20 learning outcomes. The word midpoint has had a strikethrough embellishment as it is not relevant to this study.
Outcomes (Formatted_Deleted_2).xlsx – row heights changed to double-height to match the corresponding row heights in the file Subtopics (Formatted).xlsx.
Outcomes (Formatted_Deleted_2_C).xlsx – 6 different colours used to highlight the learning outcomes that belong to the 6 topics (2.2, 4.1, 4.2, 4.3, 5.1, 5.2)
Create the database query Subtopics to produce the subtopics corresponding to the 31 learning outcomes in the domain specified in my Research Proposal.
These subtopics may be seen in the 6 topics referred to above in Strands 2, 4, 5 of the syllabus PDF file Junior Certificate Mathematics Syllabus (Foundation, Ordinary & Higher Level) for examination from 2016.
Export the output of this query to the file Subtopics.xlsx.
Edit the file Outcomes.xlsx to produce the following Excel files:
Subtopics (Formatted).xlsx – edited to fit on a single A4 page
Subtopics (Formatted_Greyed_Out).xlsx – 11 subtopics greyed out. Note: These 11 subtopics correspond to the 11 learning outcomes that don’t have connections between Strands 2, 4, 5.
Subtopics (Formatted_Deleted).xlsx – 11 subtopics deleted. Note: There are now 20 subtopics corresponding to the 20 learning outcomes. The word midpoint has had a strikethrough embellishment as it is not relevant to this study.
Subtopics (Formatted_Deleted_C).xlsx – 6 different colours used to highlight the subtopics corresponding to the learning outcomes that belong to the 6 topics (2.2, 4.1, 4.2, 4.3, 5.1, 5.2)
Create the database query Outcomes & Subtopics to produce the outcomes and corresponding subtopics for the 31 learning outcomes in the domain specified in my Research Proposal.
These outcome & subtopics may be seen in the 6 topics referred to above in Strands 2, 4, 5 of the syllabus PDF file Junior Certificate Mathematics Syllabus (Foundation, Ordinary & Higher Level) for examination from 2016.
Create a file Concepts.xlsx with the following headings:
Components
Concept Code
Concept Description
Create the following 27 concepts:
Co-ordinated Plane
Points (Dots on Plane)
Points (Names)
Points (Coordinates)
Origin (Special Dot)
Origin (Special Name)
Origin (Coordinates)
Points on x-axis
Points on y-axis
Line Segment 1
Line Segment 2
Length of Line Segment 1
Length of Line Segment 2
Line Segment 3
Right-Angled Triangle
Slope of Line Segment 3
Constant Slope
Line
Variable Slope (x ≠ 1)
Variable Slope (x = 1)
Staircase 2
Staircase 3
Staircase 2 to Sequence 2
Staircase 3 to Sequence 3
Terms
Linear Sequence
Term-to-Term Rule
This is the beginning of a major piece of work that will attempt to organise the 20 learning outcomes and 20 subtopics (see above) into a set of interconnected concepts for the domain model.
This will require the development of the following:
Information Objects. An information object focuses on a single piece of information. (Geogebra files).
Learning Objects. A learning object is a collection of information objects that are assembled to teach a single learning objective. (Multiple Geogebra files converted to HTML5).
Learning Components. A learning component is a generic term for things like lessons and courses that typically have multiple learning objectives and are composed of multiple learning objects. (Multiple Geogebra files converted to HTML5).
Concepts. These are core mathematical ideas, encapsulated in pedagogical instruction (*), that permeate and utilise information objects, learning objects, learning components and have description codes and description text.
Domain Model. This is a hierarchy of interconnected concepts. (Authored using the GAM Authoring Tool).
See http://www.reusablelearning.org/about/Granularity.html for Reusability Framework as a Function of Granularity
*See https://www.igi-global.com/dictionary/pedagogical-instruction/54371 for What is Pedagogical Instruction?
*See http://edutechwiki.unige.ch/en/Pedagogic_strategy for pedagogic strategy and instructional strategy.
_______________________________________________________________________________________________________________________________________________________________________________________________________________________________________
02/11/17 (Thursday) – Applied Project Day 13
Work on the Supervision Logbook part of my ePortfolio.
Email Caitríona and Claire the link and password to the Supervision Logbook section of my ePortfolio. (Caitríona emailed me earlier today requesting this information).
Begin organising the 27 concepts above into a hierarchy of concepts.
Explore the possibility of using the Mindomo mind mapping tool to help with this organisational process.
Explore the possibility of using the Microsoft Visio application to help with this organisational process.
Explore three different scenarios in organising the concepts into a hierarchy using the GAM Authoring Tool (GAM).
Email Marc Craenen these three different scenarios requesting advice and comment.
I also asked Marc in his email for the following information as well: (a) how to link resources to concepts (I can’t see any functionality for this) (b) when will he have a working version of GALE (amalgamated with the GAT into a single .WAR file)
_______________________________________________________________________________________________________________________________________________________________________________________________________________________________________
03/11/17 (Friday) – Applied Project Day 14
N.B. VERY IMPORTANT LINK!
A simple search for “machine learning” and “adaptive learning” in Google Search produced the following link sixth from the top:
The Mapping Lab
https://mapping.mit.edu
Concept Mapping
https://mapping.mit.edu/concept-mapping
Outcomes Mapping
https://mapping.mit.edu/outcomes-mapping
The article in the link below outlines XOCES, a Java-based widget for mapping learning outcomes, built by the MIT Mapping Lab:
XOCES (“X-oh-sis”)
https://mapping.mit.edu/projects/xoces
Rhumbl
https://rhumbl.com
Legal
https://rhumbl.com/legal
This website, Rhumbl.com (the “site”), is owned and operated by Willcox & Huang (“Rhumbl”, “we” or “us”).
Why use Rhumbl?
https://rhumbl.com/why-use-rhumbl
Good progress in using Rhumbl – see the following files in the folder Concept Mapping\Rhumbl:
MAPPING OF TOPICS AND LEARNING OUTCOMES
Rhumbl (Account Creation).png
Test1.xlsx
Excel 1 (Learning Outcomes).png
Excel 2 (Topics).png
Excel 2 (Topics).png
Excel 3 (Both).png
Rhumbl 1 (Data).png
Rhumbl 2 (Styles).png
Rhumbl 3 (Publish).png
Superb progress in using Rhumbl – see the following files in the folder Concept Mapping\Rhumbl:
MAPPING OF TOPICS AND LEARNING OUTCOMES WITH ONE-TO-MANY RELATIONSHIPS FROM LEARNING OUTCOMES TO TOPICS
LINKS TO URLs NOW INCLUDED AND WORKING
I published this concept map of a test domain and Rhumbl stored it at the following URL:
https://rhumbl.com/embed/59fcc0c294470c00102c0d18
Test2.xlsx
Rhumbl-editing (Overview).png
Rhumbl-published (Overview).png
Rhumbl-published (LO 4.1.1.1).png
Rhumbl-published (LO 4.3.2.2)
Further progress in using Rhumbl – see the following files in the folder Concept Mapping\Rhumbl:
KEYWORDS NOW INCLUDED AND WORKING
Test3.xlsx
Test4.xlsx
I published the Test4.xlsx concept map of a test domain and Rhumbl stored it at the following URL:
https://rhumbl.com/embed/5a1a17f748444e00103fd5aa
IMPORTANT
Check out the adaptive learning kit flyby at the following link:
https://mapping.mit.edu/projects/flyby
Check out the Fly-by_Wire project at the following links:
http://fbw.mit.edu
http://fbw.mit.edu/technology
http://fbw.mit.edu/team
Check out Professor Karen Wilcox, Director of MIT Mapping Lab
http://kiwi.mit.edu
Email: kwillcox@mit.edu
Check out Vijay Kumar
http://web.mit.edu/vkumar/www/
“He is also co-PI of a US Department of Education project, “Fly-By-Wire” directed towards assisting teachers in scalably addressing the learning needs of differently prepared and motivated students;”
“Towards Scalable Differentiated Instruction was awarded a 2015 Department of Education FIPSE First in the World Development Grant to develop the proposed FbW technology. The First in the World program aims to address challenges in postsecondary education for students who are at risk for not persisting in and completing postsecondary programs.”
http://fbw.mit.edu
Department Awards $60 Million in First in the World Grants to 18 Colleges, Universities and Organisations
FUNDING OF ALMOST 3 MILLION DOLLARS FOR KAREN WILCOX
Massachusetts Institute of Technology, Cambridge—$2,891,882
Karen Willcox, kwillcox@mit.edu, (617) 253-3503
https://www.ed.gov/news/press-releases/department-awards-60-million-first-world-grants-17-colleges-universities-and-organizations
Note: GRAPPLE got a contribution of EUR 3 850 000 from the EU and cost EUR 5 303 577. See link below:
http://cordis.europa.eu/project/rcn/85413_en.html
IMPORTANT
Check out:
OpenMantle Graph API
https://mapping.mit.edu/projects/openmantle
Note: Fly-by-Wire Student App is built on OpenMantle API. See the following link:
Examples
https://mapping.mit.edu/projects/openmantle-examples
Note: I subscribed to MIT to get emails about the developer API on 04/11/17
Check out Professor Karen Wilcox’s mapping publications:
Publications
https://mapping.mit.edu/publications/
Note: I set up a GitHub account.
Username = gerardkilkenny
Email = gerard.kilkenny@outlook.com
_______________________________________________________________________________________________________________________________________________________________________________________________________________________________________
04/11/17 (Saturday) – Applied Project Day 15
Research Ethics Application Form
Complete Sections 1 to 5 (and partially complete Section 6).
Sections 1 to 6 were covered in Claire McAvinia’s two part screencast.
Email Content for Research Ethics Application Form (Part 1 of 2).docx to Claire and carbon copy Caitríona Ní Shé.
“We coded 49 studies using electronic surveys. However, some of the 49 studies reported multiple surveys, and thus a total of 68 surveys were available for the meta-analysis.” (p.825)
“In our analysis, the mean response rate for the 68 surveys reported in 49 studies was 39.6% (SD = 19.6%).” (p.829)
Survey: 440 members of IMTA Dublin Branch in 1996. 39.6% of 440 = 174.24.
Interviews: 8
Total: 175 + 8 = 183
A Meta-Analysis of Response Rates in Web- or Internet-Based Survey
APA (2471)
Cook, C., Heath, F., & Thompson, R. L. (2000). A meta-analysis of response rates in web-or internet-based surveys. Educational and psychological measurement, 60(6), 821-836.
Link
https://www.researchgate.net/publication/247728397_A_Meta-Analysis_of_Response_Rates_in_Web-_or_Internet-Based_Survey
http://journals.sagepub.com/doi/abs/10.1177/00131640021970934
_______________________________________________________________________________________________________________________________________________________________________________________________________________________________________
05/11/17 (Sunday) – Applied Project Day 16
Research Ethics Application Form
Create Test4.xlsx based on Test3.xlsx
Add URLs for GeoGebra files
The latest Rhumbl URL is in respect of Test4.xlsx. It is:
https://rhumbl.com/embed/59fcc0c294470c00102c0d18
_______________________________________________________________________________________________________________________________________________________________________________________________________________________________________
??/??/17 (???day) – Applied Project Days ??, ??
Prepare presentation for WIP 1
_______________________________________________________________________________________________________________________________________________________________________________________________________________________________________
??/??/17 (???day) – Applied Project Day ??
Electronic Survey
_______________________________________________________________________________________________________________________________________________________________________________________________________________________________________
??/??/17 (???day) – Applied Project Day ??
Emails to/from Elizabeth Oldham re Electronic Survey
_______________________________________________________________________________________________________________________________________________________________________________________________________________________________________
01/12/17 (Friday) – Applied Project Day ??
Meet Elizabeth Oldham
_______________________________________________________________________________________________________________________________________________________________________________________________________________________________________
??/??/17 (???day) – Applied Project Day ??
Emails to/from Key Informants
_______________________________________________________________________________________________________________________________________________________________________________________________________________________________________
??/??/17 (???day) – Applied Project Day ??
Emails to/from Marc Craenen
_______________________________________________________________________________________________________________________________________________________________________________________________________________________________________
14/12/17 (Thursday) – Applied Project Day ??
Supervision Meeting 03
_______________________________________________________________________________________________________________________________________________________________________________________________________________________________________
16/12/17 (Saturday) – Applied Project Day ??
(1) Get screenshots of Concepts, Relationships, Visual Overview of the following projects created using the GAM Authoring Tool via http://localhost:8080/author/ :
(2) Get backups (i.e. output.zip files) of the following projects created using the GAM Authoring Tool via http://localhost:8080/author/generate :
Maths01 (Project 4)
Maths02 (Project 5)
Milkyway01 (Project 2)
Milkyway02 (Project 3)
(3) Get backups of SQL and CSV files from Sequel Pro.
(4) Download Tomcat version 8.5.24 from the following link:
https://tomcat.apache.org/download-80.cgi
(a) Under binary distributions, click on tar.gz (pgp, md5, sha1, sha512)
(b) In Finder, move the apache-tomcat-8.5.24.tar.gz file from Downloads to the home folder.
(c) Unzip the apache-tomcat-8.5.24.tar.gz file
(d) Rename the resulting apache-tomcat-8.5.24.tar.gz folder to tomcat
(5) Start the Tomcat Server as follows:
(a) Open a Terminal window.
(b) Execute the command cd tomcat
(c) Execute the command cd bin
(d) Execute the command chmod 755 *.sh
(e) Execute the command sudo ./startup.sh (returned Tomcat started) – SUCCESS!
(6) Stop the Tomcat Server as follows:
(a) Open a Terminal window.
(b) Execute the command cd tomcat
(c) Execute the command cd bin
(d) Execute the command sudo ./shutdown.sh (returned 5 lines including Using CATALINA_BASE: /Users/gerardkilkenny/tomcat)
(e) Execute the command cd ..
(f) Execute the command cd logs
(g) Execute the command cat catalina.out
(h) The 41st of 45 INFO lines states INFO: Stopping service Catalina – SUCCESS!
********* IMPORTANT – MySQL was installed a few weeks ago with Tomcat version 7.0.82 and therefore I did not need to install it again as per the instructions below*********
(7) Install MySQL as follows (instructions from https://gist.github.com/nrollr/a8d156206fa1e53c6cd6):
(a) Open a Terminal window
(b) Execute the command brew update (returned New Formulae, Updated Formulae, Deleted Formulae)
(c) Execute the command brew info mysql (returned mysql: stable 5.7.19 (bottled))
(d) Execute the command brew install mysql (returned Summary /usr/local/Cellar/mysql/5.7.19: 322 files, 234.8MB)
Caveats: (i) We’ve installed your MySQL database without a root password. To secure it run: mysql_secure_installation
(ii) MySQL is configured to only allow connections from localhost by default To connect run: mysql -uroot
(iii) To have launchd start mysql now and restart at login: brew services start mysql. Or, if you don’t want/need a background service you can just run: mysql.server start
(e) To have launchd start mysql at login, execute the command ln -sfv /usr/local/opt/mysql/*.plist ~/Library/LaunchAgents
(returned /Users/gerardkilkenny/Library/LaunchAgents/homebrew.mxcl.mysql.plist -> /usr/local/opt/mysql/homebrew.mxcl.mysql.plist)
(f) To load mysql immediately, execute the command launchctl load ~/Library/LaunchAgents/homebrew.mxcl.mysql.plist
(returned nothing)
(g) Execute the command defaults write com.apple.finder AppleShowAllFiles -bool TRUE
(h) Relaunch Finder by holding the ‘Option/alt’ key, right clicking on the Finder icon in the dock and then clicking Relaunch
(i) In Finder, go to the home folder and note that a number of hidden files are now visible including .bash_profile
(j) Make a copy of the file .bash_profile for safety reasons (.bash_profile copy 2)
(k) Right-click on the file .bash_profile and choose Get Info
(l) Click on the the lock icon under Sharing & Permissions
(m) Change all three privileges to Read & Write
(n) In Terminal, execute the command open ~/.bash_profile
(o) In TextEdit, add export MYSQL_PATH=/usr/local/Cellar/mysql/5.7.19
(p) In TextEdit, add export PATH=$PATH:$MYSQL_PATH/bin
(q) Choose File and Save
(r) Choose TextEdit and Quit TextEdit
(s) Quit Terminal using the Command and Q keys
(t) Open a new Terminal Window
(u) Execute the command mysql.server start
(returned1 Welcome to the MySQL monitor. Commands end with ; or \g.)
(returned2 Your MySQL connection id is 4)
(returned3 Server version: 5.7.19 Homebrew)
(v) Execute the command mysqladmin -u root password ‘your password’ to set the root password
Quit the mysql CLI via mysql> \q
(w) Right-click on the file .bash_profile and choose Get Info
(x) Click on the the lock icon under Sharing & Permissions
(y) Change all three privileges to Read Only
(z) Execute the command defaults write com.apple.finder AppleShowAllFiles -bool FALSE
Note 1: To start MySQL, execute the command mysql.server start
Note 2: To stop MySQL, execute the command mysql.server stop
(8) Copy the file GALE.WAR:
(a) Download the file gale.war from Marc Craenen’s email (13/12/17) to a newly created GAT 3 folder on my Mac.
(b) In Finder, copy the file gale.war from GAT 3 to tomcat/webapps
********* IMPORTANT – The environment variable GALE_HOME was set a few weeks ago and therefore I did not need to set it again as per the instructions below*********
(9) Set the environment variable GALE_HOME as follows:
(a) In Finder, create the folder gale in the home folder
(b) Open a Terminal window
(c) Execute the command defaults write com.apple.finder AppleShowAllFiles -bool TRUE
(d) Relaunch Finder by holding the ‘Option/alt’ key, right clicking on the Finder icon in the dock and then clicking Relaunch
(e) In Finder, go to the home folder and note that a number of hidden files are now visible including .bash_profile
(f) Make a copy of the file .bash_profile for safety reasons.
(g) Right-click on the file .bash_profile and choose Get Info
(h) Click on the the lock icon under Sharing & Permissions
(i) Change all three privileges to Read & Write
(j) In Terminal, execute the command open ~/.bash_profile
(k) In TextEdit, add export GALE_HOME=/gale
(l) Choose File and Save
(m) Quit Terminal using the Command and Q keys
(n) Open a new Terminal Window
(o) Execute the command echo $GALE_HOME (returned /gale) – SUCCESS!
(p) Right-click on the file .bash_profile and choose Get Info
(q) Click on the the lock icon under Sharing & Permissions
(r) Change all three privileges to Read Only
(s) Execute the command defaults write com.apple.finder AppleShowAllFiles -bool FALSE
(10) Deploy GALE as follows:
(a) Open a Terminal window.
(b) Execute the command cd tomcat
(c) Execute the command cd bin
(d) Execute the command sudo ./startup.sh
(e) In Finder, note that the folder gale has been created in the folder /tomcat/webapps with 19 files and folders
(11) Start and test GALE as follows:
(a) Open a Terminal window
(b) Execute the command cd tomcat
(c) Execute the command cd bin
(d) Execute the command sudo ./startup.sh (returned Tomcat started) – SUCCESS!
(e) Execute the command cd tomcat/logs
(f) Execute the command cat catalina.out
(g) The last line states INFO: Server startup in 11877 ms – SUCCESS!
(h) Go to a browser and type http://localhost:8080/gale
The Welcome to Gale home page appears
(i) Click on the Milkyway link
(j) Click the Login button to login anonymously
(12) When not using GALE, stop the Tomcat Server – see (6) above.
Note: Tomcat may not shut down correctly. Check that Tomcat is not running (use ps or task manager). if it is running, stop/kill the java process.
(13) Deploy GAT-AT as follows:
(a) Paste the files galedb.sql and goat.sql into the folder /usr/local/Cellar/mysql/5.7.19/bin using the Macintosh HD app on the desktop
(b) Open a Terminal window
(c) Execute the command cd /usr
(d) Execute the command cd local
(e) Execute the command cd cellar
(f) Execute the command cd mysql
(g) Execute the command cd 5.7.19
(h) Execute the command cd bin
(i) Execute the command mysql -u root < galedb.sql
(j) Execute the command mysql.server start
Note: If this doesn’t work, create and populate the two MySQL databases using Sequel Pro and using the import command to import galedb.sql and goat.sql
(k) Create a user called ‘goat’ with the password ‘l$PxgZEdkU$CKO9gLswcYVGFcBk306*ToWCUULwA’ as follows:
CREATE USER ‘goat’@’localhost’ IDENTIFIED BY ‘l$PxgZEdkU$CKO9gLswcYVGFcBk306*ToWCUULwA’;
Query OK, 0 rows affected (0.01 sec)
GRANT ALL PRIVILEGES ON * . * TO ‘goat’ @’localhost’;
Query OK, 0 rows affected (0.00 sec)
FLUSH PRIVILEGES;
Query OK, 0 rows affected (0.00 sec)
\q
Bye
(14) Start and test GAM-AT as follows:
(a) Open a Terminal window
(b) Execute the command cd tomcat
(c) Execute the command cd bin
(d) Execute the command sudo ./startup.sh
(e) Go to a browser and type http://localhost:8080/gale/gam-at
Note: GAM-AT doesn’t work. I have emailed Marc Craenen.
Note: I copied servlet-api.jar and jsp-api.jar from tomcat/lib to tomcat/bin. I also issued the following command in Terminal:
export CLASSPATH=/Users/gerardkilkenny/tomcat/bin/bootstrap.jar:/Users/gerardkilkenny/tomcat/bin/tomcat-juli.jar:/Users/gerardkilkenny/tomcat/bin/servlet-api.jar:/Users/gerardkilkenny/tomcat/bin/jsp-api.jar
The ‘persistency’ of this command was checked using echo $CLASSPATH.
Note: GAM-AT still doesn’t work.
_______________________________________________________________________________________________________________________________________________________________________________________________________________________________________
17/12/17 (Sunday) – Applied Project Day ??
(1) Write up the minutes of Supervision Meeting 03 that took place in DIT, Aungier Street on Thursday 14/12/17.
(2) Post these minutes on my ePortfolio.
(3) Write and send an email to Claire McAvinia with queries in relation to the marksheet and assessment criteria as applicable to my Applied eLearning Project.
(4) Send email to Ciarán Ó Conaill, SEC proposing a Friday afternoon in February or March 2018 as a possible meeting time for the semi-structured interview.
_______________________________________________________________________________________________________________________________________________________________________________________________________________________________________
18/12/17 (Monday) – Applied Project Day ??
(1) Telephone call from Ciarán Ó Conaill, SEC in relation to Fridays not being suitable in 2018 for the semi-structured interview.
(2) We agreed that the interview would take place instead on a Tuesday, Wednesday or Thursday afternoon during February or March 2018 in SEC offices in Athlone.
(3) Ciarán suggested asking Rachel Linney, NCCA to participate in an interview. He kindly offered to ask her and asked me to send an information email that he can pass on to her. Snowballing!
(4) Ciarán informed me that the final version of the specifications for the new Junior Cycle Mathematics course is now available. However, this PDF document will not be available online until January 2018. I asked Ciarán to ask Rachel if this PDF file can be emailed to me. I offered to send an email with this request and also containing assurances that I will not divulge details of this document or disseminate it if I receive it in December 2018. I have sent this email to Ciarán.
(5) Send emails to the 11 non-Dublin branches of IMTA requesting them to send a link to the digital artefacts / electronic survey in January 2018.
For other branches: see http://www.imta.ie/in-your-area/ … though some a
_______________________________________________________________________________________________________________________________________________________________________________________________________________________________________
??/??/?? (???day) – Applied Project Day ??
(1) Receive emails from 3 of the 11 non-Dublin branches of IMTA requesting them to send a link to the digital artefacts / electronic survey in January 2018.
(2) Replies to these 3 emails.
_______________________________________________________________________________________________________________________________________________________________________________________________________________________________________
25/12/17 (Monday) – Applied Project Day ??
(1) Try to get the new and old versions of GALE and GAT (GAM-AT) working on my website. Despite valiant efforts, no cigar!
_______________________________________________________________________________________________________________________________________________________________________________________________________________________________________
26/12/17 (Tuesday) – Applied Project Day ??
Create the folder C:\Adaptive Learning Databases\Mk 5 (New JC) on my laptop.
Copy the Microsoft Access database file Adaptive Maths Rel Pop Query Test C.mdb from the folder Mk4 to Mk5.
Delete the content of this database file and repopulate it with the following topic data from the syllabus PDF file Draft Specification for Junior Cycle Mathematics: November 2017:
U Unifying Strand
N Number Strand
GT Geometry and Trigonometry Strand
AF Algebra and Function Strand
SP Statistics and Probability Strand
Note 1: There are now 4 strands instead of 5. Algebra (old Strand 4) and Functions (old Strand 5) are no longer separate strands. They have been amalgamated into a single strand called Algebra and Functions.
Note 2: There is now a ‘Unifying Strand’ containing 6 elements. The 2 elements that are of interest to this research study are ‘Element 2: Representation’ and ‘Element 3: Connections’.
Element: Representation
Students should be able to:
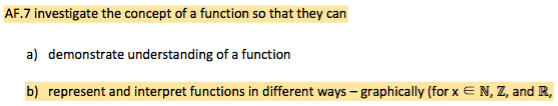
U.4 represent a mathematical situation in a variety of different ways, including: numerically, algebraically, graphically, physically, in words – and to interpret, analyse, and compare such representations
Element: Connections
Students should be able to:
U.5 make connections within and between strands
U.6 make connections between mathematics and the real world
_______________________________________________________________________________________________________________________________________________________________________________________________________________________________________
27/12/17 (Wednesday) – Applied Project Day ??
The structure of the new draft syllabus is quite different to the old one. Now there is a three tier structure of learning outcomes. For example, 2 (b) (iii) in the new draft document means 2 is the main outcome (Tier 1), (b) is a sub-outcome (Tier 2) of outcome 2 and (iii) is a sub-outcome (Tier 3) of sub-outcome (b).
Therefore, I needed to delete all of the content in C:\Adaptive Learning Databases\Mk 5 (New JC) on my laptop and create an entirely new database. This meant creating new tables, relationships and queries.
Today, I have creating the database structure and I have tested it with some content from the new draft document.
_______________________________________________________________________________________________________________________________________________________________________________________________________________________________________
28/12/17 (Thursday) – Applied Project Day ??
Today, I populated the new database with all of the content from the new draft document. This was a fairly large task and took the entire day.
_______________________________________________________________________________________________________________________________________________________________________________________________________________________________________
29/12/17 (Friday) – Applied Project Day ??
Today, was a very important day.
I exported the domain content for my Applied Project from Microsoft Access to Microsoft Excel.
Then, I formatted this content in Excel.
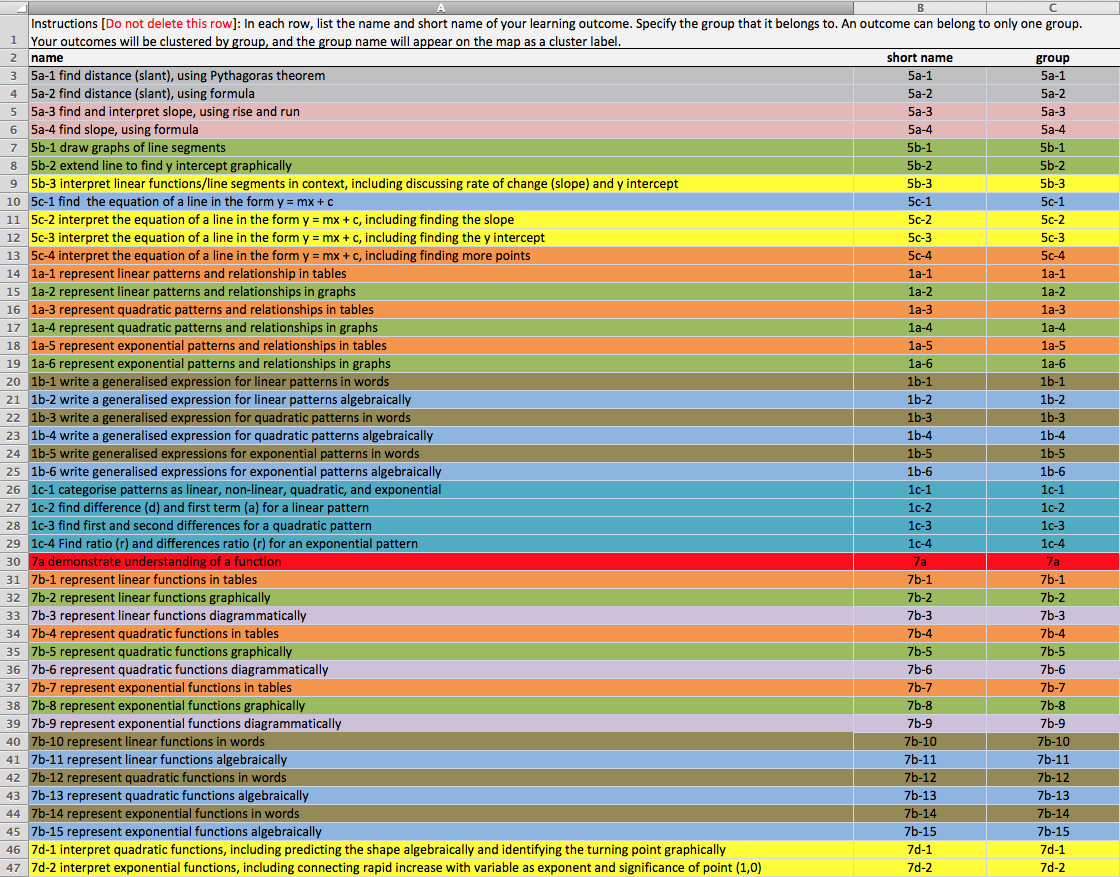
N.B. However, the most important thing I did today was to to deconstruct the domain content of the syllabus and ‘unpack’ the 7 syllabus learning outcomes to 39 learning outcomes created by me. This will allow a number of things to happen:
(1) create connections within and between strands
(2) create a structured domain model with sequenced and connected concepts
(3) change the granularity from coarse to fine-grained
Ultimately, this fine-grained domain model will allow for:
(1) a better adaptive learning systems because this greater number of nodes in the domain model will be mirrored by a similarly greater number of nodes in the user model
(2) better diagnostics because this greater number of nodes in the domain and users models will allow for more nuanced ‘bug detection’
(3) the SEC to perform better sampling of syllabus content, due to this ‘granularity engineering’. The increased granularity, combined with connections being made explicit, should result in better examination questions
Model granularity in engineering design – concepts and framework (2017)
http://oro.open.ac.uk/47878/
(4) PME students to have a better perspective of the new Junior Cycle maths syllabus and to provide them with a ‘roadmap for teaching’.
_______________________________________________________________________________________________________________________________________________________________________________________________________________________________________
30/12/17 (Saturday) – Applied Project Day ??
Today: Mindomo (Day 1 of 2)
I created 8 mind maps from the Excel file containing the 39 learning outcomes. The mind maps evolve from the earliest MathAL-1.mom to the more complex MathAL-8.mom
This was a time consuming process. I am discovering that the creation of a domain model using mind mapping software is a challenging but interesting and intellectually rewarding process.
I’m beginning to think that mind mapping is the most appropriate method to create a domain model for mathematics.
José Feliciano
_______________________________________________________________________________________________________________________________________________________________________________________________________________________________________
31/12/17 (Sunday) – Applied Project Day ??
Today: Mindomo (Day 2 of 2)
Today, was a very important day.
I created 16 mind maps from the Excel file containing the 39 learning outcomes. The mind maps evolve from yesterday’s MathAL-8.mom to the ever more complex MathAL-24.mom
Once again, this was a time consuming process.
Realisations:
(1) I’m becoming convinced that mind mapping is the most appropriate method to create a domain model for mathematics.
(2) I’m beginning to think that the GAM Authoring Tool is not a suitable tool to create a domain model for mathematics. The reason is that this tool creates domain models using a text based interface. After creating the domain model, inputted as text-based concepts and relationships, it is then possible to see a visual display (map) of these concepts and relationships. Mondomo utilises the reverse paradigm, i.e. create a mindmap (visual display) which can be displayed as outline text.
(3) I don’t think that it will be possible to produce a domain model similar to the one that I have created in Mindomo.
Important Idea:
It may be that the concept map that was used to create the domain model may have another very important purpose. The parts of the concept map that are relevant in particular contexts could be highlighted, possibly using different colours. For example,
an SEC exam question could be deconstructed into its constituent concepts and these constituent concepts could be highlighted on the domain model concept map. The student could compare the highlighted part of the domain model with his/her user model scores (displayed in different colours to indicate competencies in different concepts). Similarly, a teacher could compare the parts of the domain model that they have taught to their class thus far with past SEC exam questions for a particular topic to ascertain which concepts they have not yet taught to their class. The teacher could also compare those concepts in the domain model, associated with topics for a particular class test, with the combined (overlay) user model scores for that class test. This would help the teacher decide which concepts should be revised later in the semester.
Note: I received an email from Rhumbl incoming me that they have increased my free man from one to five.
_______________________________________________________________________________________________________________________________________________________________________________________________________________________________________
01/01/18 (Monday) – Applied Project Day ??
Today: Rhumbl (Day 1 of 2)
Create an Excel file Q – Outcomes – Tier 2 – E – Edited – 3.xlsx and save as R – Outcomes – Tier 2 – E – Edited – 3.
Note: Q denotes that the Excel file began as an Access Query and R denotes that this file is a stage along the route of developing the final Rhumbl Excel file.
Realisation:
The NCCA outcomes (approximately 7) were unpacked to a much greater (approximately 40) number of more finely grained outcomes.
However, because of the similarities between patterns, functions and co-ordinate geometry of the line (in the case of linear patterns and functions), I am advocating that connections be made between these 40 learning outcomes. Part of today’s work was to amalgamate similar learning outcomes. This smaller number of amalgamated learning outcomes will pedagogically result in a smaller number of teaching topics. (See ‘Next Step’ below).
Next Step:
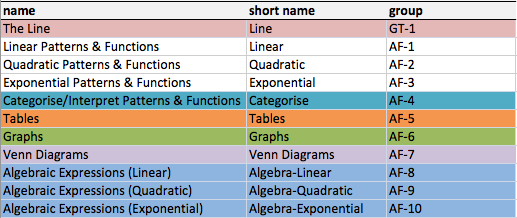
The Excel spreadsheet template that Rhumbl uses connects learning outcomes with topics. Learning outcomes are in spreadsheet columns while topics are in spreadsheet rows.
Tomorrow, I will create topics. There will be a much smaller number of topics than learning outcomes. (See ‘Realisation’ above).
_______________________________________________________________________________________________________________________________________________________________________________________________________________________________________
02/01/18 (Tuesday) – Applied Project Day ??
Mindomo
I decided to upgrade my account for Mindomo from Desktop Free to Desktop Premium. The main reason for this is that I am limited to 40 topics per map for the free account. The premium account provides me with unlimited topics per map. The other reason is that there is an export option to Excel that is not available in the free version. This is a lifetime licence with 12 months free updates and support costing €39.00 + 23% VAT = €47.97
Excel
Today, I created 5 topics and 28 outcomes, a process that I began yesterday. This was tedious and required a lot of thought, reflection and editing. Colour coding was important in reducing the 46 outcomes to 28 outcomes using a categorisation process. There are now 7 important colours each representing a type of outcome.
Realisation:
7 outcomes (NCCA) —> 46 outcomes (Me) —> 5 topics and 28 outcomes (Me)
7 outcomes (NCCA) —> analyse & unpack to 46 outcomes (Me) —> analyse, categorise & pack to 5 topics and 28 outcomes (Me)
_______________________________________________________________________________________________________________________________________________________________________________________________________________________________________
03/01/18 (Wednesday) – Applied Project Day ??
Mindomo
I decided to create a new Mindmap called MathAL-Organigram-01 in Mindomo. I used the Organigram template structure instead of the Concept Map template structure. I think that this new way of representing a domain model is much better. It reveals a symmetric structures for the cycle of concepts for linear, quadratic, exponential patterns and functions.
Moreover, this is probably a faster method of creating a domain model as an organigram has a more coherent structure than a concept map. However, it took time experimenting with the arrangement of the concepts for the inherent conceptual structures of the domain patterns and functions to reveal itself. Now that more geometric structures have been arrived at, it is also worth noting that it is possible to copy and paste parts of Mindomo’s organigram to create replicate structures. This should be useful for creating domain models which have repeating internal structures.
Realisation:
Possibly a metaphor of stepping stones is more appropriate than the metaphor of scaffolding in relation to how a student is led along a journey through a series of concepts. Each stone is a concept of the domain model. If the the stones are too far apart, the student struggles or sinks! If the stones are not correctly arranged, the student is led down a wrong pathway and becomes lost. Scaffolding is vertical and quite linear. If you fall, you are finished. Stepping stones are horizontal and quite planar. if you fall, you struggle but are not finished.
Next Steps:
(1) Due to the repetitive nature of the domain model across linear, quadratic and exponential, it should be possible top create another concept map containing 19 concepts instead of 48 concepts. Here is the arithmetic:
48 – 29 = 19
(2) Colour code the Mindomo maps using similar colours used in the Excel spreadsheet yesterday.
(3) Edit the Excel spreadsheet to reflect the changes that have taken place with the Mindomo organigram/domain model.
_______________________________________________________________________________________________________________________________________________________________________________________________________________________________________
04/01/18 (Thursday) – Applied Project Day ??
GAM Authoring Tool
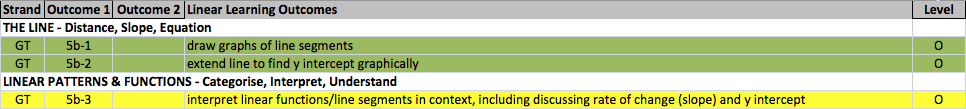
(1) Create domain model based around a three part domain model consisting of: Fatterns, The Line, Categorisation and Interpretation
Note: It is not possible to order Concept Types in the accordion menu because there is no rank field. So, I have stuck to using solely Concepts with no Concept Types.
(2) A big disadvantage of the visual display is that the concepts can’t be manipulated by dragging them to whatever position one wishes. The author has no control as to then position the branches will appear. For example, one might wish to have a branch of concepts appear above another two branches but instead it might appear in between.
Note: It is not possible to edit a Relationship. Instead, one must delete the existing relationship and then add a new one.
Note: Labelling of concepts is very restrictive limiting the author to alphanumeric strings of 15 characters or less. The first character can’t be a number.
_______________________________________________________________________________________________________________________________________________________________________________________________________________________________________
05/01/18 (Friday) – Applied Project Day ??
Editing
Edit the Excel file (Unpacked Learning Outcomes and Amalgamated Learning Outcomes) and Mindomo Map simultaneously. This was a tedious, time consuming but ultimately worthwhile endeavour. I believe that this has resulted in better quality domain models.
N.B. Trying to achieve consistency and symmetry between the patterns concepts and functions concepts in the Mindomo Map caused me to make changes to the Excel spreadsheet of Unpacked Learning Outcomes and Amalgamated Learning Outcomes.
For example, there were two separate learning outcomes in the Excel spreadsheet as follows:
7d-1 interpret quadratic functions, including predicting the shape algebraically
7d-2 interpret quadratic functions, including identifying the turning point graphically
In the Mindomo mindmap, this was a single learning outcome as follows:
So, I amalgamated 7d-1 and 7d-2 into a single learning outcome as follows:
interpret quadratic functions, including predicting the shape algebraically and identifying the turning point graphically
Significant Progress towards the Design of a Domain Model for a Relational Database:
I created a new Mindomo file called MathAL-Organigram-04 where I substituted the Learning Outcome Codes (1b-1, 1b-2) for Learning Outcome Descriptions that were in MathAL-Organigram-03 as (Word Expression, Algebra Expression).
This is significant as I can now see that it should be possible to create a relational database using these codes as unique descriptors for concepts and/or learning outcomes. Connections between the concepts can be mirrored as relations between fields in a relational database.
Realisation:
Mindmap very good for injecting pedagogy into the domain model, i.e. discovering the best pathways.
Excel is very good for cross-crossing checking my unpacked learning outcomes with the NCCA syllabus learning outcomes.
Idea for PhD:
The design and evaluation of a domain mapping system for Mathematics. This could be a Google Maps for Mathematics involving the mapping and visualisation of data in 2D and possibly 3D.
Note: Contact Sarah Carthy via LinkedIn in relation to her successful funding from the Irish Research Council (IRC) for her PhD in terrorism. She appeared on RTE’s Late Late Show on 05/01/18. Her LinkedIn link is as follows:
https://ie.linkedin.com/in/sarah-carthy-939441a4
Idea for Naming Connectors in Domain Model:
It’s worth exploring whether or not I should use the U descriptors in the syllabus as labels for the connectors in my Mindomo domain model. In the section The Element: Connections, the descriptor U.5 is described as “make connections within and between strands.”
Important for the Future:
Research information visualisation in the context of hypertext. As a starting point, look at the following link:
Visualizing the Evolution of a Subject Domain: A Case Study
http://www.pages.drexel.edu/~cc345/papers/infovis99.pdf
_______________________________________________________________________________________________________________________________________________________________________________________________________________________________________
07/01/18 (Sunday) – Applied Project Day ??
Mindomo
Create the file MathAL-Organigram-04C which is a coloured version of MathAL-Organigram-04.
GAM Authoring Tool
Adapt the domain model for a linear function for (a) quadratic – see screenshot SS_11_Q (b) exponential – see screenshot SS_11_E
Extend the domain model to include Coordinate Geometry – The Line – see screenshots SS_12 to SS_21 inclusive.
_______________________________________________________________________________________________________________________________________________________________________________________________________________________________________
13/01/18 (Saturday) – Applied Project Day ??
Mindomo
Create the following Mindomo files:
Organigram-03-1C (Linear/Quadratic/Exponential as one set of learning outcomes)
Organigram-03-1C (Linear/Quadratic/Exponential as one set of learning outcomes plus The Line)
Make improvements to all the Mindomo files such as colour consistency, branching, subscripts for Tn.
Publish online versions with the following links:
Organigram-03C Mk2.mo
https://www.mindomo.com/mindmap/organigram-03c-mk2-1fefed0a6e9d54d8fbb1bdc588b27a53
Organigram-04C Mk2.mom
https://www.mindomo.com/mindmap/organigram-04c-mk2-3e03f5f559f740e6869bac1cf17de5ab
_______________________________________________________________________________________________________________________________________________________________________________________________________________________________________
14/01/18 (Sunday) – Applied Project Day ??
Excel
Make improvements to the file R – Outcomes – Tier 2 – E – Edited – 4a.xlsx and save it as R – Outcomes – Tier 2 – E – Edited – 4b.xlsx
Rhumbl
Work on a new version of the Excel spreadsheet template in order to create a new Rhumbl concept map. This Excel files is R – Outcomes – Tier 2 – E – Edited – 4b.xlsx
This required extensive work creating 11 topics and making connections to the 45 learning outcomes.
This resulted in three new versions of the Excel file as follows:
Rhumbl – 4b Mk1.xlsx
Rhumbl – 4b Mk2.xlsx
Rhumbl – 4b Mk3.xlsx
Publish online version with the following link:
Rhumbl – 4b Mk3.xlsx
https://rhumbl.com/engine/embed/5a5be19b4791b10010c8b9d2
_______________________________________________________________________________________________________________________________________________________________________________________________________________________________________
20/01/18 (Saturday) – Applied Project Day ??
Adobe Captivate Tutorial
Begin to create an Adobe Captivate tutorial. The file name is Math-AL Mk01.cptx.
This day long process led to the creation of a revised tutorial Math-AL Mk02.cptx.
I managed to learn how to use of the Adobe Captivate closed captioning facility.
Important
I was unhappy with the Adobe Captivate tutorials for a number of reasons:
(1) I think that the format of using (cartoon type) characters as avatars is inappropriate for the target audience of adult Maths teachers.
(2) Bitmap graphics are poorly resized and rendered in low quality graphics. This makes the domain models difficult to read.
(3) I have come to the conclusion that tutorial is not the best mode to try to impart to my audience the rationale for my research project and more specifically the concept of a domain model.
_______________________________________________________________________________________________________________________________________________________________________________________________________________________________________
21/01/18 (Sunday) – Applied Project Day ??
Adobe Captivate Screencast using PowerPoint.
I began the process of experimenting with the production of an Adobe Captivate Screencast. There are a number of possible ways to create a screencast with Captivate. One method is to use PowerPoint slides for the parts of the screencast that do not involve displaying the domain models in web applications such as Mindomo, Rhumbl and GAM-AT.
This day long process was difficult, tedious and frustrating. The main problem was that Adobe Captivate appears unable to capture a Powerpoint file in normal full screen presentation mode. It can only capture the PowerPoint presentation slides in edit mode and this means that the surrounding PowerPoint tools and panes are displayed.
_______________________________________________________________________________________________________________________________________________________________________________________________________________________________________
23/01/18 (Tuesday) – Applied Project Day ??
Adobe Captivate Screencast using Microsoft PowerPoint and Adobe Reader.
It is possible to export an entire PowerPoint file to Adobe Captivate format. However, this would possibly mean that the file would not be in screencast mode meaning that it could be difficult to add the screencasting of the domain model web apps (Mindomo, Rhumbl and GAM-AT) later. Instead, I decided to save the fledgling Powerpoint presentation as an Adobe Reader document that would be used as the basis for the non-web apps part of the screencast. The rendering of the graphics looks good so this is promising.
N.B. The Process
(1) Add the required digital assets (splash screen photo, screen captured bitmaps of domain models, extracted PDF pages from NCCA documents, etc) to the PowerPoint file.
(2) Use the PowerPoint facilities to create text headings.
(3) Export the PowerPoint file as an Adobe Reader PDF file.
(4) Use Adobe Captivate to record an audio narration for each slide.
(5) Edit the narration audio using Adobe Captivate’s audio management facility.
(6) Add the narration text using Adobe Captivate’s closed captioning facility.
(7) Synchronise the narration audio with the closed captions using Adobe Captivate’s audio management/closed captioning facility.
Closed Captions
Advice to use Arial (a sans-serif font) and a font size of 22 for closed captions.
How to Do Closed Captioning Right
Today – Screens 1 to 7.
_______________________________________________________________________________________________________________________________________________________________________________________________________________________________________
10/02/18 (Saturday) – Applied Project Day ??
Adobe Captivate Screencast using Microsoft PowerPoint and Adobe Reader.
Today – Expand PowerPoint file (Artefact Mk04.pptx) and Captivate file (Artefact Mk04.cptx) to include Screens 8 to 13.
_______________________________________________________________________________________________________________________________________________________________________________________________________________________________________
11/02/18 (Sunday) – Applied Project Day ??
Adobe Captivate Screencast using Microsoft PowerPoint and Adobe Reader.
Today – Expand PowerPoint file (Artefact Mk05.pptx) and Captivate file (Artefact Mk05.cptx) to include Screens 14 to 20.
_______________________________________________________________________________________________________________________________________________________________________________________________________________________________________
12/02/18 (Monday) – Applied Project Day ??
Adobe Captivate Screencast using Microsoft PowerPoint and Adobe Reader.
Today – Expand PowerPoint file (Artefact Mk06.pptx) by 20 slides based on screenshots, with highlighted text annotation.
These were the result of performing the following operations on the old and new syllabuses:
(1) Printing single page PDF files, from the syllabus documents (old and new), using Apple Preview.
(2) Annotating these single page PDF files using the highlight text annotation tool in Apple Preview.
(3) Opening these single page PDF files in Adobe Reader.
(4) Capturing specific portions of these single page PDF files using Apple Mac screen capturing keyboard shortcuts.
(5) Adding the resulting screenshots (.PNG files) to PowerPoint slides using the insert picture function.
Note: See the sub-folder 2018-02-12 in the ePortfolio folder that has screenshots that help document this process of creating an Adobe Captivate screencast for my MSc Applied Project. These contain 19 old syllabus files and 32 new syllabus files that I created today. These 51 files were used to create 20 new PowerPoint slides.
_______________________________________________________________________________________________________________________________________________________________________________________________________________________________________
13/02/18 (Tuesday) – Applied Project Day ??
Adobe Captivate Screencast using Microsoft PowerPoint and Adobe Reader.
Today – Expand PowerPoint file (Artefact Mk07.pptx) by many slides based on screenshots.
Today – Major housekeeping job in relation to file management. Too many duplicate files and folder system had become unwieldy.
_______________________________________________________________________________________________________________________________________________________________________________________________________________________________________
14/02/18 (Wednesday) – Applied Project Day ??
Adobe Captivate Screencast using Microsoft PowerPoint and Adobe Reader.
Today – Add Rhumbl section to main PowerPoint file (Artefact Mk08.pptx) for main Captivate screencast.
Today – Edit and finish subsidiary PowerPoint file (GAM_AT-DM Mk4.pptx) for subsidiary Captivate screencast (GAM_AT-DM Mk4.cptx). These files demo the GAM-AT domain model.
_______________________________________________________________________________________________________________________________________________________________________________________________________________________________________
15/02/18 (Thursday) – Applied Project Day ??
Adobe Captivate Screencast using Microsoft PowerPoint and Adobe Reader.
Today – Add Mindomo section to main PowerPoint file (Artefact Mk09.pptx) for main Captivate screencast.
Today – Edit GAM-AT and Rhumbl sections of main PowerPoint file (Artefact Mk09.pptx) for main Captivate screencast.
Today – During today’s session, save as new main PowerPoint file (Artefact Mk10.pptx) for main Captivate screencast.
_______________________________________________________________________________________________________________________________________________________________________________________________________________________________________
16/02/18 (Friday) – Applied Project Day ??
Adobe Captivate Screencast using Microsoft PowerPoint and Adobe Reader.
Today – During today’s session, finish development of the main PowerPoint file (Artefact Mk11.pptx and Artefact Mk12.pptx) for main Captivate screencast.
Today – Import Artefact Mk12.pptx into a new (blank) main Adobe Captivate screencast file called Demo-02-1.cptx.
Today – Export the audio (exports as both .wav and .mp3 files) from the previous main Adobe Captivate screencast file (Demo-01-20.cptx).
Today – Export the closed captions from Demo-01-20.cptx. This ends up as a Microsoft Word file but was of no use because you can’t import a closed captions file int a different Adobe Captivate file.
Today – Import the .mp3 audio files, one screen at a time, into the new main Adobe Captivate screencast file called Demo-02-1.cptx.
_______________________________________________________________________________________________________________________________________________________________________________________________________________________________________
17/02/18 (Saturday) – Applied Project Day ??
Import already created audio for slides 11 to 20. Save Adobe Captivate file as Demo-02-20.cptx
Create text narration for slides 21 to 35.
Record audio narration for slides 21 to 35.
Create synchronised closed captions for slides 21 to 35.
Note: The process of recording and creating closed captions took 2.5 hours for 15 slides. This is equivalent to 10 minutes per slide. I think that it should be possible to so this in 2 hours as I made errors with re-naming some audio files.
_______________________________________________________________________________________________________________________________________________________________________________________________________________________________________
18/02/18 (Sunday) – Applied Project Day ??
continue with creating and editing screencasts to 87 slides long (by Friday 02/03/18)
continue with creating versions 2 and 3 of survey
send links to Screencast and Survey to Maths Department
_______________________________________________________________________________________________________________________________________________________________________________________________________________________________________
03/03/18 (Saturday) – Applied Project Day ??
Download SD SFX (Chill) (Background Music 01) 2:20, 100 ppm at the following link:
Preview & Download Background Music Tracks 1-23
This is 2 minutes 14 seconds of background music for the GAM-AT Captivate presentation.